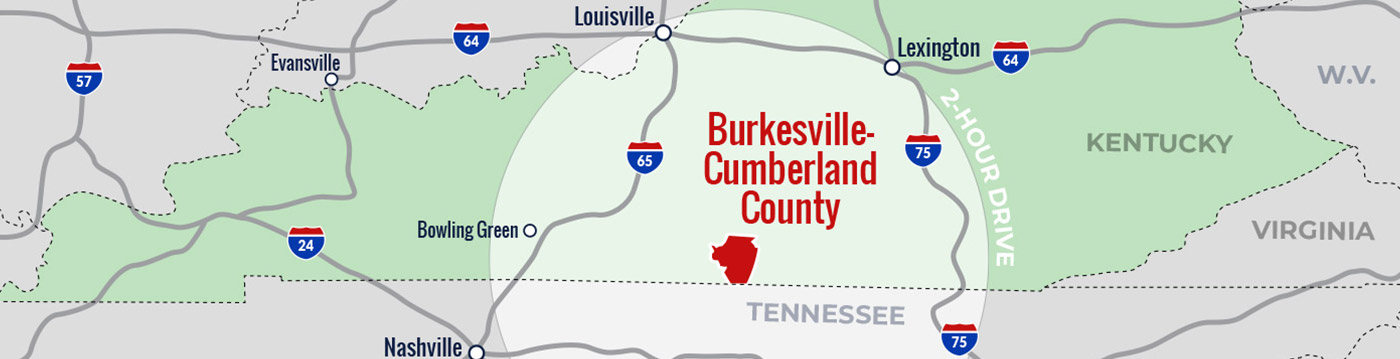
Cumberland County
Population
Back To Top
Population
| Population | 2000 | 2010 | 2023 | 2028 |
|---|---|---|---|---|
| Cumberland County | 7,147 | 6,856 | 5,677 | 5,458 |
Source: ESRI, 2023-10-17
Population by Age
| Population | 2010 | 2023 | 2028 |
|---|---|---|---|
| 0-4 | 438 | 304 | 286 |
| 5-9 | 411 | 336 | 301 |
| 10-14 | 403 | 318 | 336 |
| 15-19 | 464 | 284 | 306 |
| 20-24 | 329 | 263 | 233 |
| 25-29 | 347 | 335 | 237 |
| 30-34 | 324 | 293 | 296 |
| 35-39 | 379 | 337 | 298 |
| 40-44 | 461 | 304 | 330 |
| 45-49 | 506 | 310 | 301 |
| 50-54 | 544 | 385 | 311 |
| 55-59 | 478 | 403 | 388 |
| 60-64 | 463 | 472 | 413 |
| 65-69 | 401 | 402 | 428 |
| 70-74 | 328 | 362 | 335 |
| 75-79 | 253 | 252 | 296 |
| 80-84 | 184 | 169 | 193 |
| 85+ | 143 | 148 | 170 |
| 18+ | 5,332 | 4,554 | 4,355 |
| Median Age | 44 | 46 | 47 |
Source: ESRI, 2023-10-17
Population by Race
| Cumberland County | 2023 |
|---|---|
| Total | 5,677.00 |
| White Alone | 92.34 |
| Black Alone | 2.64 |
| American Indian Alone | 0.11 |
| Asian Alone | 0.07 |
| Pacific Islander Alone | 0.11 |
| Some Other Race | 0.70 |
| Two or More Races | 4.03 |
| Hispanic Origin | 1.43 |
| Diversity Index | 16.90 |
Source: ESRI, 2023-10-17
Growth Rate
| Cumberland County | 2023 - 2028 |
|---|---|
| Population | -0.78% |
| Households | -0.47% |
| Families | -0.54% |
| Median Household Income | 3% |
| Per Capita Income | 3% |
Source: ESRI, 2023-10-17
Back To TopHousing
Back To Top
Households
| Population | 2000 | 2010 | 2023 | 2028 |
|---|---|---|---|---|
| Households | 2,976 | 2,883 | 2,517 | 2,458 |
| Housing Units | 3,567 | 3,690 | 3,333 | 3,257 |
| Owner Occupied Units | 1,866 | 1,833 | ||
| Renter Occupied Units | 651 | 625 | ||
| Vacant Units | 816 | 799 |
Source: ESRI, 2023-10-17
Home Value
| Cumberland County | 2023 | 2028 |
|---|---|---|
| Median Home Value | $150,343 | $158,570 |
| Average Home Value | $160,182 | $167,894 |
| <$50,000 | 229 | 204 |
| $50,000 - $99,999 | 464 | 419 |
| $100,000 - $149,999 | 237 | 215 |
| $150,000 - $199,999 | 437 | 458 |
| $200,000 - $249,999 | 317 | 330 |
| $250,000 - $299,999 | 31 | 35 |
| $300,000 - $399,999 | 118 | 137 |
| $400,000 - $499,999 | 0 | 0 |
| $500,000 - $749,999 | 19 | 21 |
| $1,000,000 + | 0 | 0 |
Source: ESRI, 2023-10-17
Housing Year Built
| Year Range | Houses Built |
|---|---|
| 2010 or Later | 222 |
| 2000-2009 | 528 |
| 1990-1999 | 491 |
| 1980-1989 | 642 |
| 1970-1979 | 580 |
| 1960-1969 | 332 |
| 1950-1959 | 274 |
| 1940-1949 | 204 |
| 1939 or Before | 139 |
Source: ESRI, 2023-10-17
Back To TopIncome
Back To Top
Income
| Cumberland County | 2023 | 2028 |
|---|---|---|
| Median Household | $37,936 | $43,690 |
| Average Household | $55,091 | $62,685 |
| Per Capita | $24,455 | $28,260 |
Source: ESRI, 2023-10-17
Household Income Base
| Cumberland County | 2023 |
|---|---|
| <$15,000 | 674 |
| $15,000 - $24,999 | 243 |
| $25,000 - $34,999 | 265 |
| $35,000 - $49,999 | 307 |
| $50,000 - $74,999 | 431 |
| $75,000 - $99,999 | 167 |
| $100,000 - $149,999 | 368 |
| $150,000 - $199,999 | 31 |
| $200,000+ | 31 |
Source: ESRI, 2023-10-17
Back To TopEmployees
Back To Top
Commute
| Category | Commuters |
|---|---|
| Workers 16+ | 2,170 |
| In-County Residents | 1,622 |
| Out-of-County Residents | 514 |
| Drive Alone | 1,732 |
| Carpooled | 202 |
| Public Transport | 11 |
| Work at Home | 166 |
| Less than 5 minutes | 169 |
| 5-9 minutes | 301 |
| 10-14 minutes | 395 |
| 15-19 minutes | 347 |
| 20-24 minutes | 217 |
| 25-29 minutes | 66 |
| 30-34 minutes | 194 |
| 35-39 minutes | 52 |
| 40-44 minutes | 57 |
| 45-59 minutes | 90 |
| 60-89 minutes | 97 |
| 90+ minutes | 19 |
| Average Travel Time | 20 |
Source: ESRI, 2023-10-17
Source: ESRI, 2023-10-17
Employees by NAICS
| Category | Number |
|---|---|
| Total Employees | 1,939 |
| Agr/Forestry/Fish/Hunt | 6 |
| Mining | 10 |
| Utilities | 39 |
| Construction | 50 |
| Manufacturing | 99 |
| Wholesale Trade | 172 |
| Retail Trade | 203 |
| Motor Veh/Parts Dealers | 26 |
| Furn & Home Furnish Str | 0 |
| Electronics & Appl Store | 3 |
| Bldg Matl/Garden Equip | 22 |
| Food & Beverage Stores | 86 |
| Health/Pers Care Stores | 18 |
| Gasoline Stations | 3 |
| Clothing/Accessory Store | 2 |
| Sports/Hobby/Book/Music | 14 |
| General Merchandise Str | 29 |
| Misc Store Retailers | 0 |
| Nonstore Retailers | 0 |
| Transportation/Warehouse | 27 |
| Information | 68 |
| Finance & Insurance | 50 |
| Cntrl Bank/Crdt Intrmdtn | 35 |
| Sec/Cmdty Cntrct/Oth Inv | 0 |
| Insur/Funds/Trusts/Other | 15 |
| Real Estate/Rent/Leasing | 33 |
| Prof/Scientific/Tech Srv | 45 |
| Legal Services | 22 |
| Mgmt of Comp/Enterprises | 0 |
| Admin/Support/Waste Mgmt | 0 |
| Educational Services | 168 |
| HealthCare/Social Assist | 393 |
| Arts/Entertainment/Rec | 74 |
| Accommodation/Food Srvcs | 332 |
| Accommodation | 159 |
| Food Srv/Drinking Places | 173 |
| Other Srv excl Pub Admin | 74 |
| Auto Repair/Maintenance | 3 |
| Public Administration Emp | 96 |
Source: ESRI, 2023-10-17
Educational Attainment (25+)
| Cumberland County | 2023 |
|---|---|
| Some High School | 492 |
| Graduated High School | 1,672 |
| Associates Degree | 210 |
| Bachelor's Degree | 411 |
| Graduate Degree | 212 |
Source: ESRI, 2023-10-17
Back To TopBusinesses
Back To Top
Businesses by NAICS
| Category | Number |
|---|---|
| Total Businesses | 243 |
| Agr/Forestry/Fish/Hunt Bus | 3 |
| Mining Bus | 2 |
| Utilities Bus | 5 |
| Construction Bus | 8 |
| Manufacturing Bus | 7 |
| Wholesale Trade Bus | 11 |
| Retail Trade Bus | 42 |
| Motor Veh/Parts Dealers Bus | 6 |
| Furn & Home Furnish Str Bus | 0 |
| Electronics & Appl Store Bus | 1 |
| Bldg Matl/Garden Equip Bus | 4 |
| Food & Beverage Stores Bus | 8 |
| Health/Pers Care Stores Bus | 3 |
| Gasoline Stations Bus | 2 |
| Clothing/Accessory Store Bus | 1 |
| Sports/Hobby/Book/Music Bus | 8 |
| General Merchandise Str Bus | 9 |
| Misc Store Retailers Bus | 0 |
| Nonstore Retailers Bus | 0 |
| Transportation/Warehouse Bus | 6 |
| Information Bus | 7 |
| Finance & Insurance Bus | 12 |
| Cntrl Bank/Crdt Intrmdtn Bus | 7 |
| Sec/Cmdty Cntrct/Oth Inv Bus | 0 |
| Insur/Funds/Trusts/Other Bus | 5 |
| Real Estate/Rent/Leasing Bus | 13 |
| Prof/Scientific/Tech Srv Bus | 13 |
| Legal Services Bus | 5 |
| Mgmt of Comp/Enterprises Bus | 0 |
| Admin/Support/Waste Mgmt Bus | 0 |
| Educational Services Bus | 5 |
| HealthCare/Social Assist Bus | 19 |
| Arts/Entertainment/Rec Bus | 7 |
| Accommodation/Food Srvcs Bus | 20 |
| Accommodation Bus | 6 |
| Food Srv/Drinking Places Bus | 14 |
| Other Srv excl Pub Admin Bus | 32 |
| Auto Repair/Maintenance Bus | 3 |
| Public Administration Bus | 21 |
Source: ESRI, 2023-10-17
Back To Top